Good morning. It is a pleasure and an honour to have been invited to give this presentation today at the Nikkei Smart City Week conference. The subject of my talk is architecture – not only the architecture of buildings but, also, the architecture of public space: the space that we move through and live our lives in; the glue that binds us together.

In the first part of my presentation I will address three key questions:
First, what is a Smart City?
Second, how can a Smart City be planned & governed?
Third, where is the place for technology in the Smart City?
And I will relate each of these questions to the architecture of space.

In the second part of my presentation I will describe the very significant effort that the UK is making to plan for its urban future, embracing the opportunities that new technologies provide.

In the third part of my presentation I will describe the use of computer modelling techniques in the creation of the London 2012 urban masterplanning process.
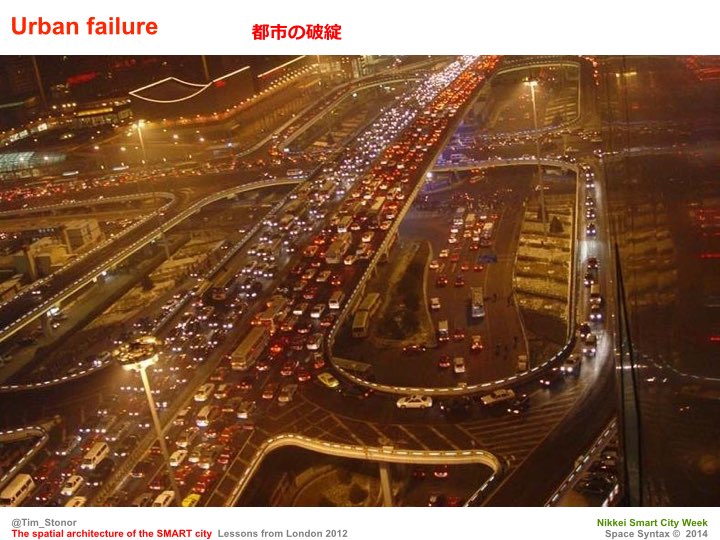
Rapid global urbanisation provides the opportunity to create striking, new forms of city living, supported by the proliferation of new “smart” technologies. Nevertheless, the delirious enthusiasm of architects and planners should be set against the sobering reality of recent urban history. From pedestrian precincts to cul de sacs and upper level walkways, many innovations in town planning and design have been launched with great optimism over the years, only to create blight in the form of massive social and economic cost. Past results matter greatly for the future planning of cities because professional failure creates public concern and this affects political confidence.
So, before beginning to create visions for novel urban futures, those responsible – the architects, planners and engineers as well as the policymakers and politicians – should first ask why past plans didn’t deliver what was intended. Why, in seeking social harmony, wealth and resilience have cities become divided, unequal and car-dependent?There seem to be two key reasons for urbanism’s inability to accurately forecast the effects of its actions:

…first, the scarcity of real knowledge about how people behave in cities and what the impacts of these behaviours are on, for example: social cohesion, economic impact and safety.

Second, the shortage of accurate and reliable forecasting tools to test plans in advance. Until recently it has been expensive and time-consuming to overcome these issues: teams of observers with clipboards have been costly; transcribing video has been a slow and intensive process; computational power has been inadequate and expertise limited.
Too often, science has had to give way to fanciful ideas from architects and planners: creations that have little resemblance to real human needs.
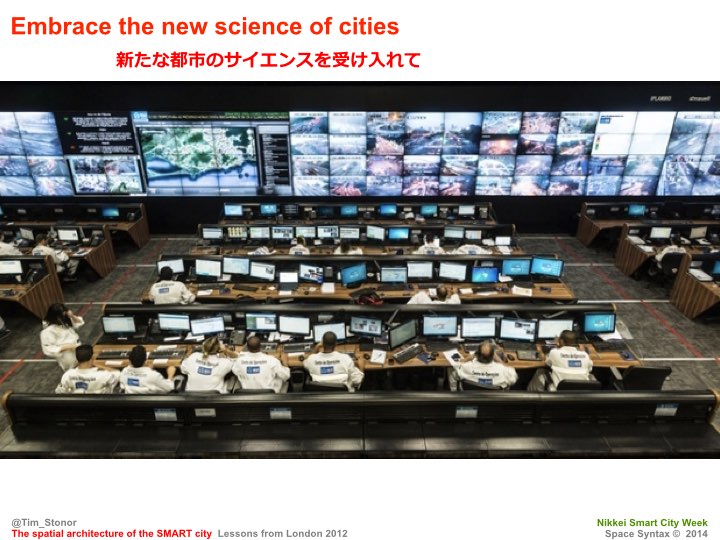
However, the rise of the “smart” era has witnessed an explosion of data capture and analysis techniques, as well as the technology-literate operators trained to use them. The opportunity now exists for organisations, both public, private and community-based, to behave differently: to build databases of urban performance, analyse the patterns within these, then create future plans in a more robust manner. The prospect of a new science for cities is real: a new, evidence-informed and analytic approach to urban planning and design that might obviate, or at least reduce, uncertainty in future urban decision-making.

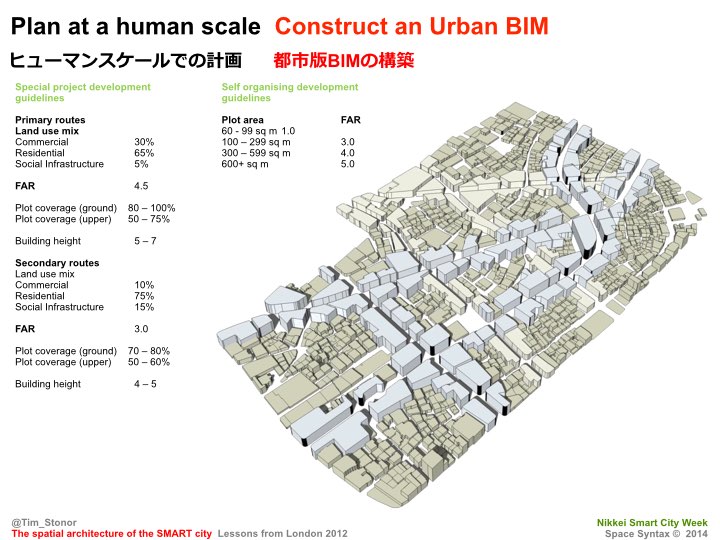
Such an opportunity raises fundamental questions about what datasets should be collected and how these should then be analysed. Fundamentally, the ways in which built environment data is used must change. To put it simply, architects need to think at a broader scale than before, planners at a finer grain and both professions need tools that fit these purposes. Currently, architects use Building Information Modelling (BIM) systems that handle data at the building level. While BIM can stretch to small clusters of buildings, it does not usually allow buildings to be set in their wider urban contexts. As a result, the important influence of context on place is lost and too many buildings are designed in isolation, with obviously negative results once built: turning their backs to each other, or surrounding themselves with empty landscaping.
Planners on the other hand tend to work from regional and city-wide scales down to local neighbourhood levels, where their engagement with urbanism stops. But this approach can prove too crude to provide an accurate picture of what is going on at the important human scale. Planners should be able to analyse data to inform decisions – such as transport plans or changing land values -– at least down to the level of the individual street segment and ideally to the different buildings that make up the street level.
An integrated modelling system should allow all of the buildings to talk to each other, then all the blocks in a neighbourhood to talk with each other, then all the neighbourhoods within a district to talk to each other and so on. This would be an “Urban BIM”: an Urban Building Information Management System that links different professionals working across multiple spatial scales.
But what does “talking to each other” actually mean? It certainly involves visualisation of data on a common platform. But it also means going beyond visualisation into data analysis, correlation and modelling. Too many conference presentations and media articles about so-called smart cities focus on – sometimes obsess about – the visualisation of data, creating dazzling maps and video clips, but often going no further. Captivating an audience is an important first step in raising awareness of the potentials of a data-driven approach; demonstrating that the data contains the intelligence to inform real urban change is the next key step.

Urban modelling systems should deliver the full potential of recent technological change by not only visualising data but, more importantly, identifying patterns within those data and establishing correlational relationships between different datasets. After all, urban planning and design practice necessitates the simultaneous analysis and resolution of multiple, complex issues.
Urban modelling should seek to serve these ends, being able, for example, to associate input decisions on spatial layout and land use allocation to outcome phenomena such as land value, movement, crime risk and carbon emissions. Urban modelling systems – based on algorithms that make sense of urban complexity – should equip architects, planners and stakeholders generally to properly weigh up the pros and cons of different options in delivering outcomes. In short, a smarter approach is required, one that lets users take a sequence of considered actions:
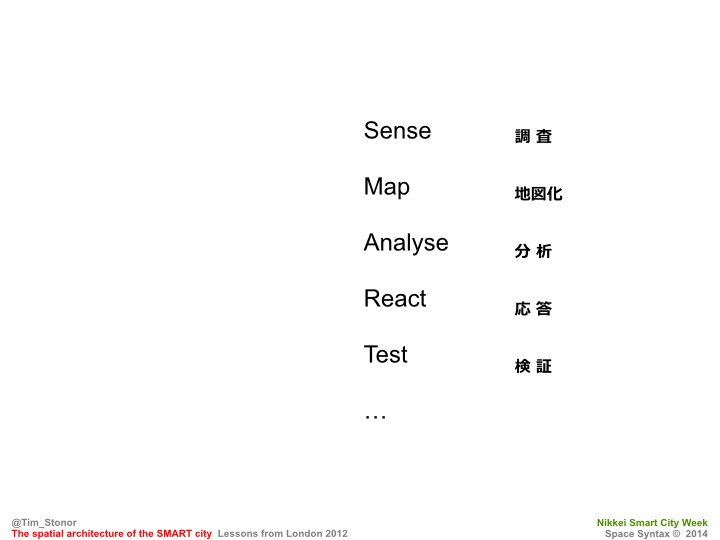
This approach has five important steps:
Sense
Capture useful “urban performance” data such as the demographics of a particular place, location of different types of retail, types of employment and typical travel patterns as well as “urban form” data including spatial accessibility, topography, building location, capacity and condition.
Map
Spatially visualise that data. For example: develop maps that geolocate the various urban performance and urban form characteristics.
Analyse
Use statistical tools to search the data for patterns, associations and correlations such as links between observed pedestrian movement data and spatial accessibility levels. Factor in the land use attraction created by shops and transport nodes. Identify algorithms that make sense of the data.
React
Produce evidence-based policies, plans and detailed designs.
Test
Use algorithm-based predictive analytics to forecast the impacts of proposals in advance. For example, infer via a model simulation where residents are likely to want to travel to in the city and what sort of uptake there might be for a new bus route or cycle path. Use the results of these forecasts to discuss ideas with stakeholders, trying out different options for changing the area and reviewing how these would impact on the way the city works, in order to decide on which one would be most appropriate.
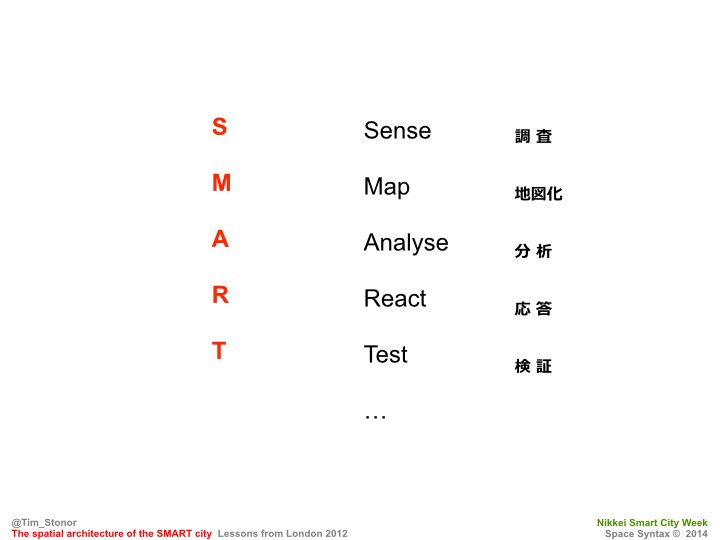
A SMART approach.
which includes the monitoring of a building or urban development post-construction to provide feedback that will help refine and further develop the forecast models. In other words, repeat the SMART cycle through further sensing, mapping, analysis, reaction and testing.

My company Space Syntax has pioneered the creation of SMART urban models for over 25 years, using the increasingly sophisticated capabilities of 2-dimensional and 3-dimensional digital platforms to produce ever more capable urban planning decision-making systems. Much experience has been gained during this time in the methods and tools required to develop models that meet the needs of public, private and community organisations. These are models that can be used in a strategic mode to robustly test the wide-scale urban planning impacts of various options, but are sufficiently detailed to inform architectural and landscape design discussions at a later point in the process.
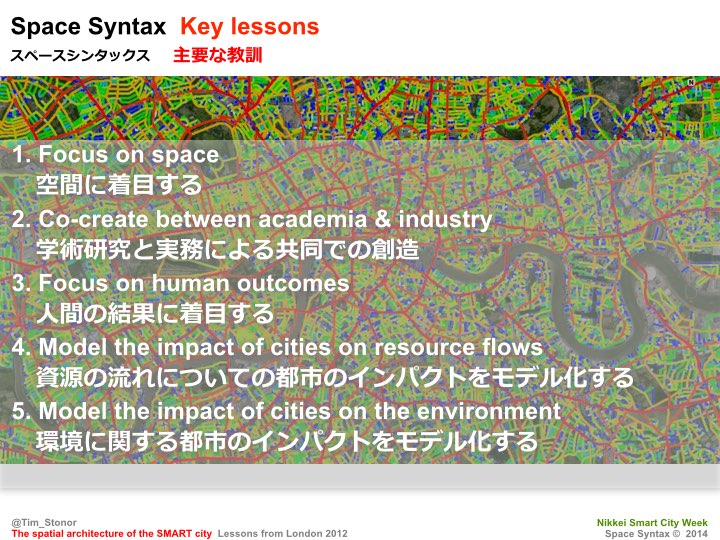
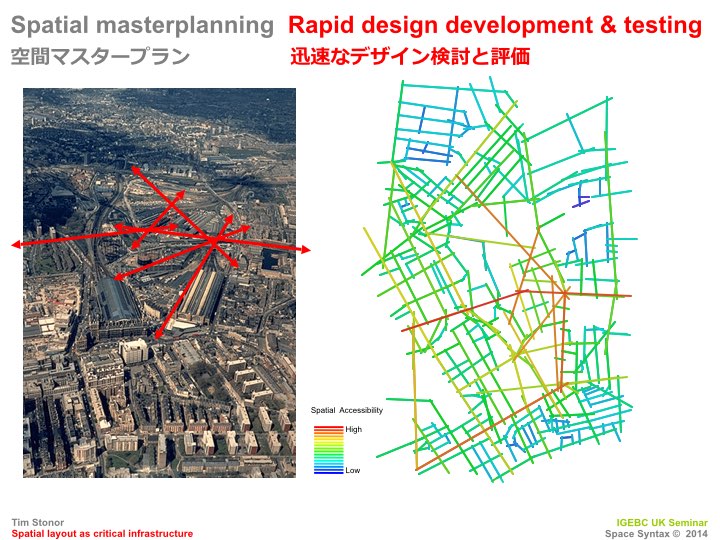
The first fundamental characteristic of our SMART approach is a focus on space: Space Syntax has created an approach to spatial network analysis that uses the pattern of street connections as a “data framework” onto which other datasets are hung. We do this because we have discovered that spatial networks have fundamental influences on human behaviour. More connected places in red, for example, can generate higher movement flows, land values and social potentials. Disconnected places in blue can suffer from social isolation and economic underperformance. We have found that it is essential to put spatial analysis at the heart of urban modelling, not least because it is in space that people meet each other and through space that they move. Our experience from stakeholder discussions shows that people understand space intuitively and respond positively to spatial analysis because, it seems, we all “read” space naturally. Our clear conviction is that, without spatial network analysis, Smart City models are missing their most essential ingredient.
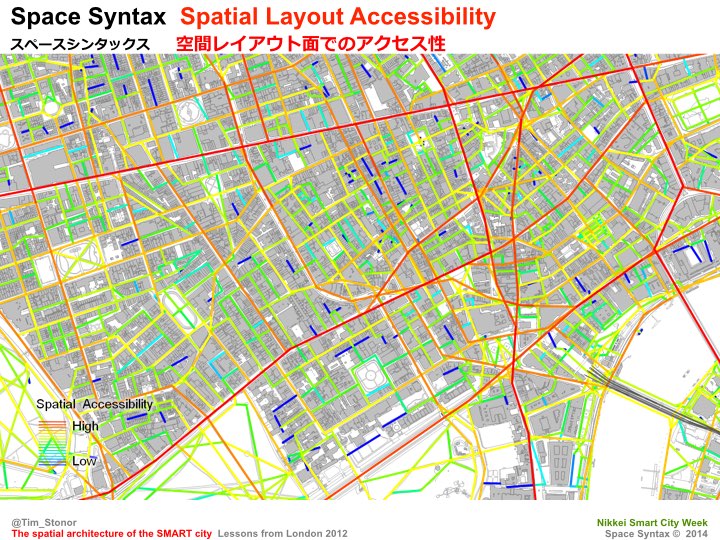
For example, the spatial hierarchy of London’s street network – calculated using Space Syntax software – highlights the most accessible streets in red. These are the routes that are most likely to be travelled along by people journeying across the city.

Analysis of London’s land use pattern – evolved over centuries – shows that the retail uses in red have located themselves on these same, highy connected routes. 80% of the retail has located on the 20% most spatially accessible streets. This is no coincidence – shops locate where the people are going to be. And people locate, we have discovered, according to the spatial hierarchy.
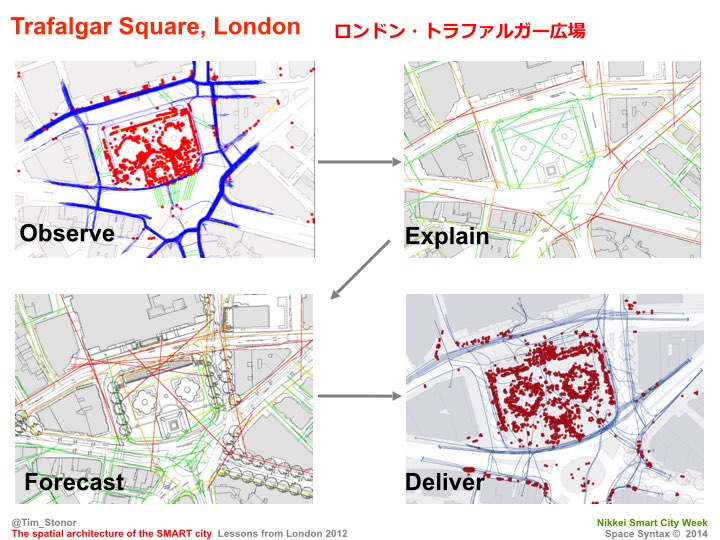
We have found that the sensing, mapping and analysis of datasets – as we did here in the redesign of Trafalgar Square in London – provokes an informed, science-based reaction among policy-makers, planners and designers. In a similar way, our experience is that stakeholders respond more positively to objectively tested proposals – that are evidence-based and supported by visualised analysis – than they do to instinctive, unsupported, opinion-based ideas.
At Trafalgar Square we showed how the seemingly complex patterns of pedestrian movement were actually very simply explained by the spatial hierarchy of the square – people followed the most direct routes around the outside of the space. This helped us work with Norman Foster to redesign the square around a new staircase that would allow new, direct routes through the heart of the space.
Space Syntax’s SMART approach to urban modelling equips local authorities with agile models of how urban areas work across a range of scales. These models are used to evaluate the likely impacts of planning and design proposals on local places as well as on the wider city. They work quickly to inform constructive discussions, which might otherwise degenerate into protracted and emotional conflict. This expedites evidence-based decisions, giving local authorities firm grounds, for example, to negotiate design changes with property developers.
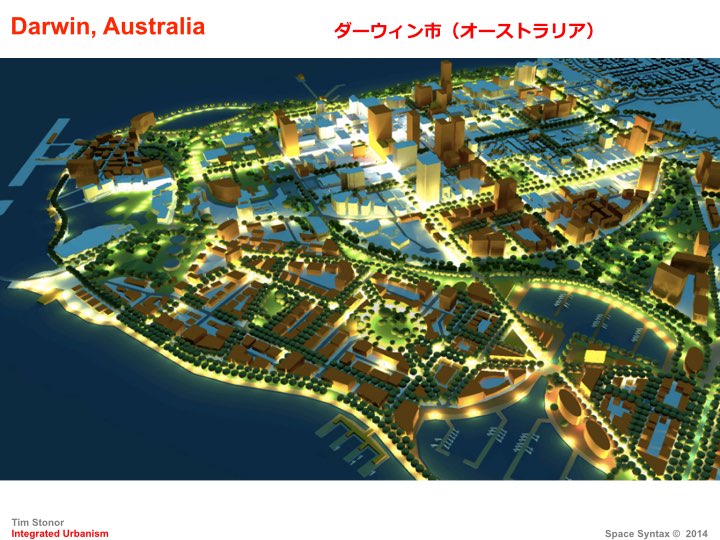
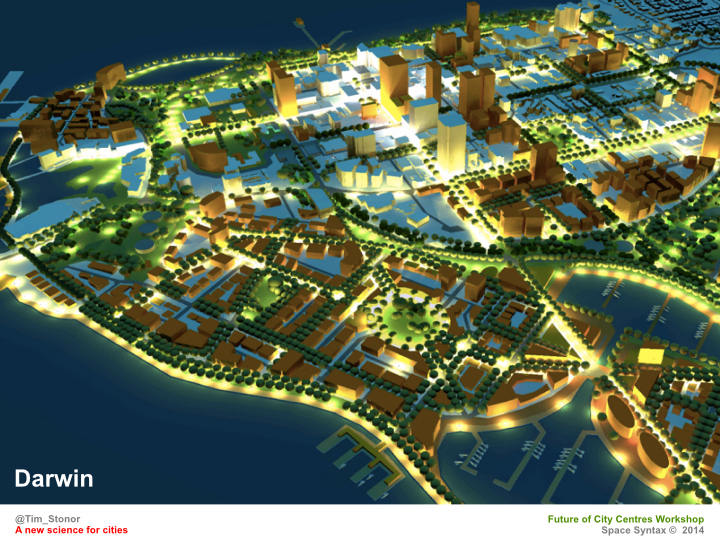
And, to create sensational designs for new urban places, as in our masterplan for the city of Darwin, Australia, where the modelling has been used to measure the impact of the new development on transport patterns of people on foot, on bicycles and in vehicles – as well as the impact on land values.

By measuring the correlations between spatial accessibility and land values it is possible to compare a Disconnected layout on the left with a Connected layout on the right – and, in this case for a development in central London, to identify half a billion US dollars of difference in land values.
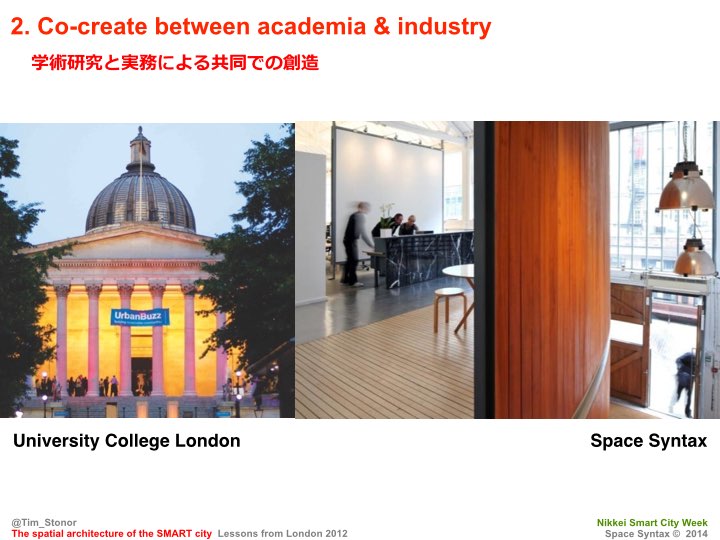
Our 25-year experience as one of the world’s leading urban modelling and design companies is itself based on a 40-year research programme at University College London, pioneered by Professor Bill Hillier. A close working relationship between consultancy and world-leading university brings deeply studied academic techniques into urban planning and building design practice. In return, the data and the learning from project applications is taken back into the rigorous research environment of a university setting. This two-way process of co-creation is the second fundamental characteristic of Space Syntax’s SMART approach: continuous co-creation – between academic researchers and professional practitioners for mutual benefit.
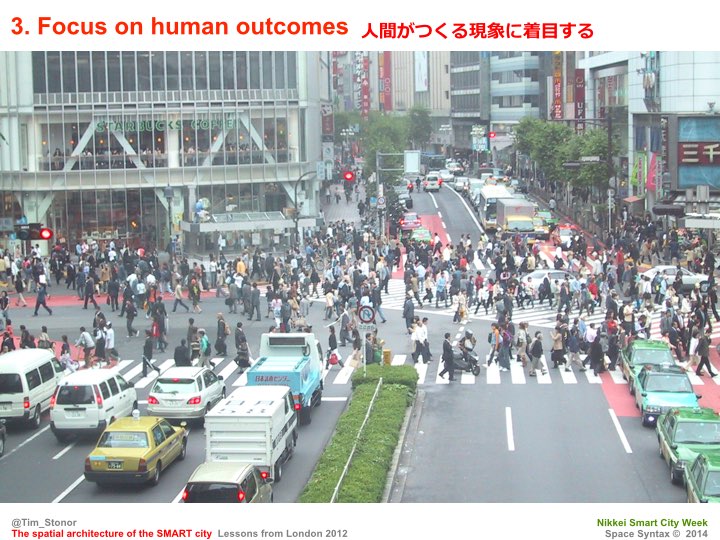
The third key feature of Space Syntax’s methodology is its focus on human outcomes above data inputs. The approach is fundamentally concerned with the social, economic and environmental impacts of the planning and design process on people. In practice, this means collecting data on human behaviour patterns: movement patterns on foot, bicycle and in vehicles; standing, sitting and interaction patterns in streets and public spaces; as well as data on socio-economic demographics, crime and health patterns.
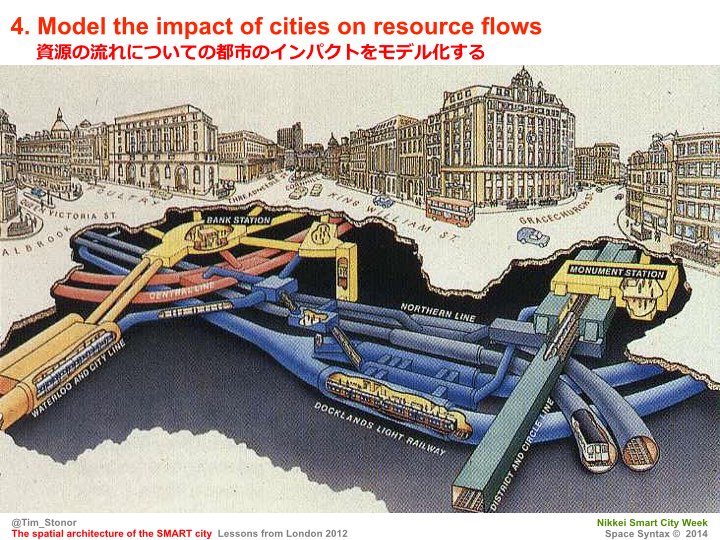
Modelling the impact of resource flows is a fourth key feature: the supply of transport connections, energy and other utilities such as water and telecoms,…
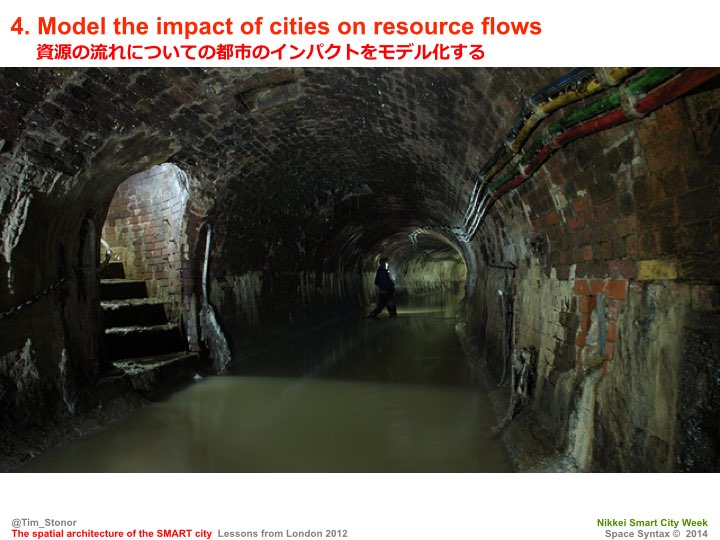
…as well as the handling of waste. Spatial network analysis is again powerful because many utilities are laid in line with street networks, both above and below ground. When urban planners set out a street pattern they are not only determining patterns of movement and human interaction but also the flows of resources that support those behaviours.
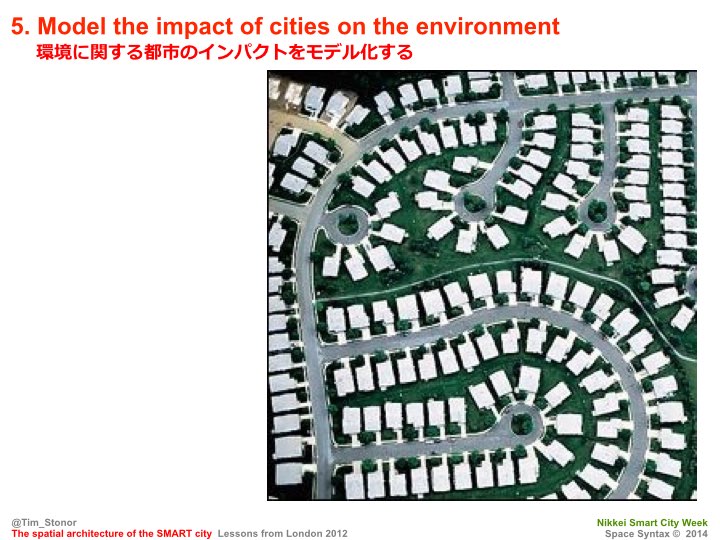
The city is the largest intended object of collective human creation and its interactions with the environment need to be analysed and understood with modelling. This relationship is handled by the fifth fundamental characteristic of Space Syntax SMART models, which connects spatial network analysis to environmental features. For example, sun path analysis is linked to spatial accessibility analysis to modify the overall attraction of a highly connected street if that street is in full sun and a highly shaded, and if less direct, alternative is available. In a similar way, linked analyses can be used to optimise the layout of an urban grid by aligning the geometry of the street pattern to the angle of the prevailing breeze.
Together, these five fundamental characteristics define Space Syntax’s approach to the creation of Integrated Urban Models that help people make decisions to influence behaviour change towards more resilient, more sustainable ways of living. Built on open source code and increasingly moving to open data platforms, Space Syntax’s aim is to disseminate the approach into general urban practice – to share the benefits of a SMART approach to urban planning, design and governance that has been tried and tested for over a quarter of a century. We believe that this approach sets a new standard for the planning and management of cities.

This diagram summarises Space Syntax’s approach to the creation of Integrated Urban Models. Our process begins at the top left, with the inputting of data, and ends bottom right with data coming out of the model. In between is a process of visualisation and analysis that leads to the creation of urban planning and design ideas, which are then discussed by stakeholders, leading to actions being taken that can change human behaviour patterns for more sustainable and resilient outcomes.
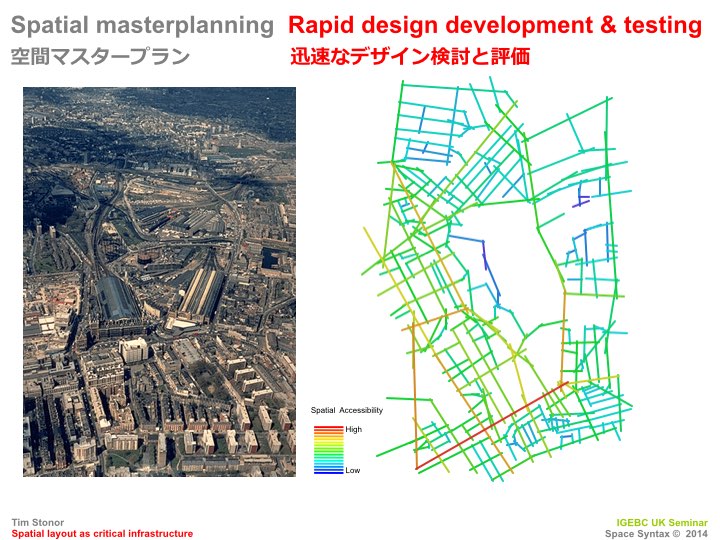
Architects and urban planners can use this modelling approach as a creative design tool.
The model lets people – both professional and non-professional – to test ideas in a quick and highly visual way, providing rapid feedback that saves time and money.
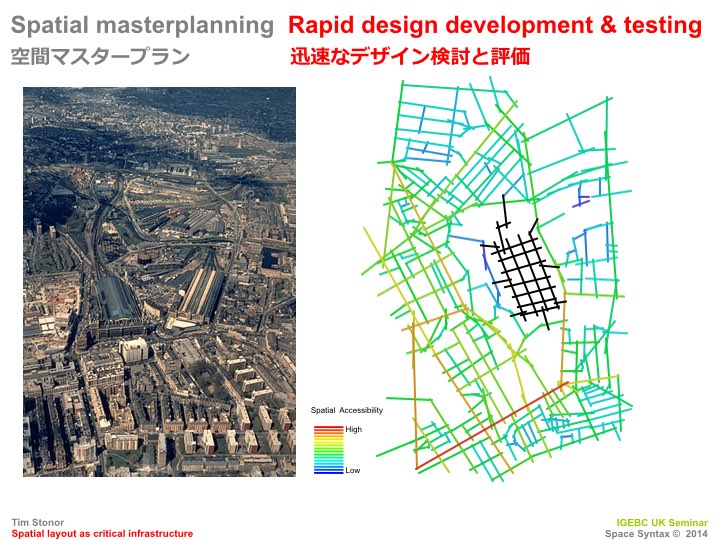
For example this first grid like option…
…produces a weak pedestrian movement structure.
This plan is therefore not going to work.

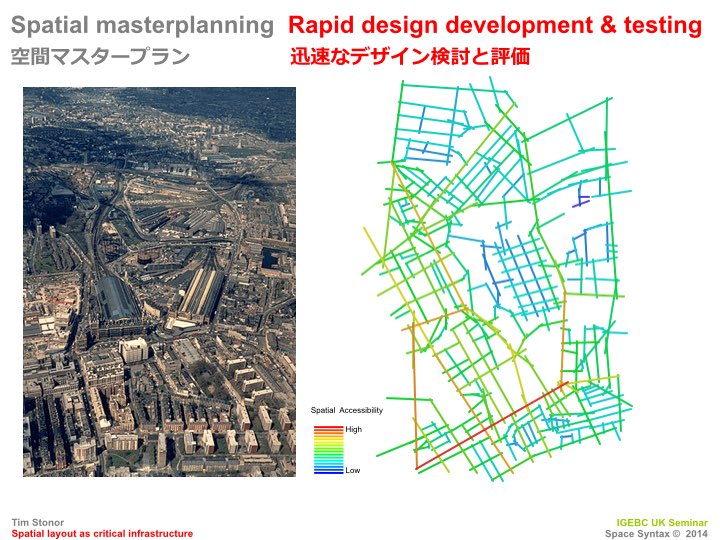
However, a more integrated route structure that links development into the right strategic connections surrounding the site…
…is shown by the computer modelling to produce a powerful and coherent movement structure.
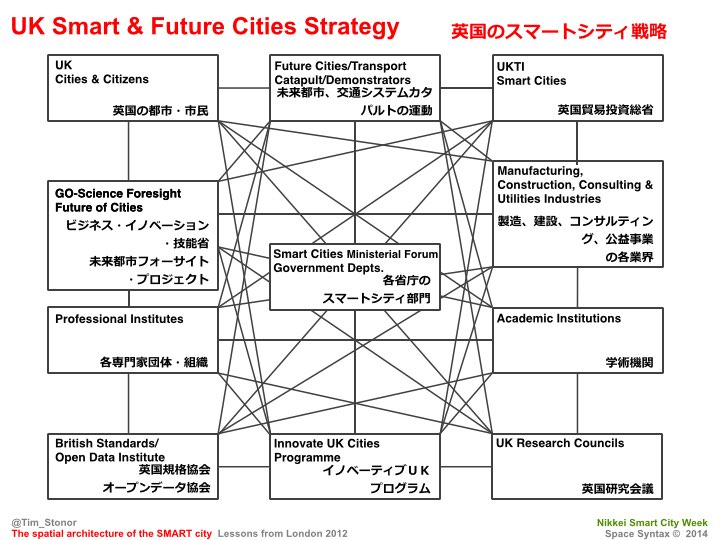
So, let me turn to the second part of my presentation. The UK government – supported by academia, business and civic society – is putting a huge effort into planning its urban future. This diagram describes the numerous organisations that are networked into the overall UK effort, which is coordinated by the Smart Cities Ministerial Forum under the chairmanship of the Minister for Cities, Greg Clark MP. As you can see it is a complex web of connections. Let me highlight some of the elements in which I am personally involved.

The UK Government Office for Science is currently running a major Foresight project on the Future of Cities and I am a member of its Lead Expert Group. We are looking to establish a scientific evidence base on what is known about cities and what the trends are for their long-term futures, looking up to 50 years ahead.

The aim of the project is to provide central and local government with an evidence base to support decisions in the short term which will lead to positive outcomes for cities in the long term.
We are working across many different spatial scales, looking at the interrelationships between the UK system of cities and at the interrelationships between the many different systems that make up any particular city: transport systems, education systems, energy and waste systems.
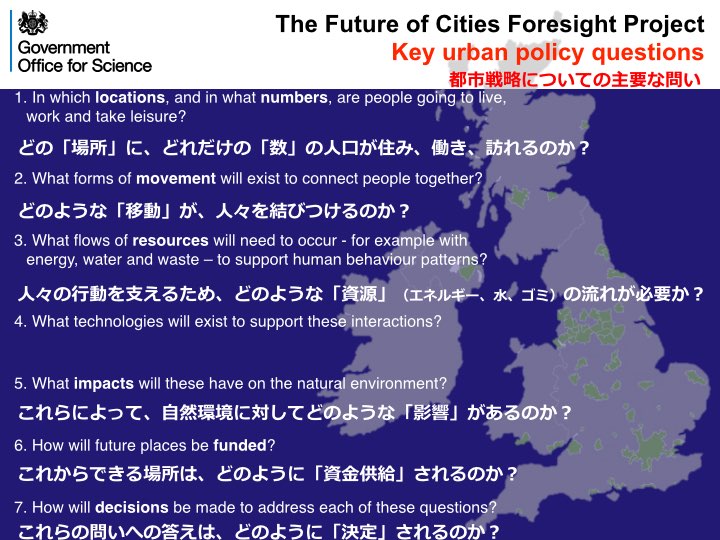
The future of cities will be decided by answers to key urban policy questions. In which locations, and in what numbers, are people going to live, work and take leisure? What forms of movement will exist to connect people together? What flows of resources will need to occur – for example with energy, water and waste – to support human behaviour patterns? What technologies will exist to support these interactions and what impacts will these have on the natural environment? How will future places be funded and, ultimately, how will decisions be made to address each of these questions?
These are the key issues that the Government Office for Science project is addressing.
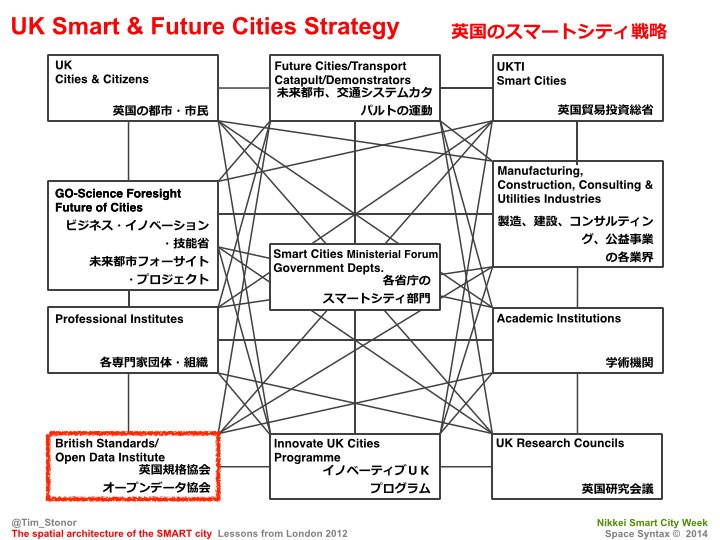
I am also assisting the British Standards Institute in the creation of standards for Smart and Future Cities. Our aim is to provide city leaders and practitioners with consistent guidance on how to achieve a Smart City.

There are three kinds of standard: first, technical standards that describe outcomes; second, process standards that describe the methods that can be followed to achieve these outcomes; and third, strategic standards that describe why a Smart City is a desirable kind of city. We are emphasising the human aspects of the Smart City as much as the technological performance of, for example, sensors and displays.
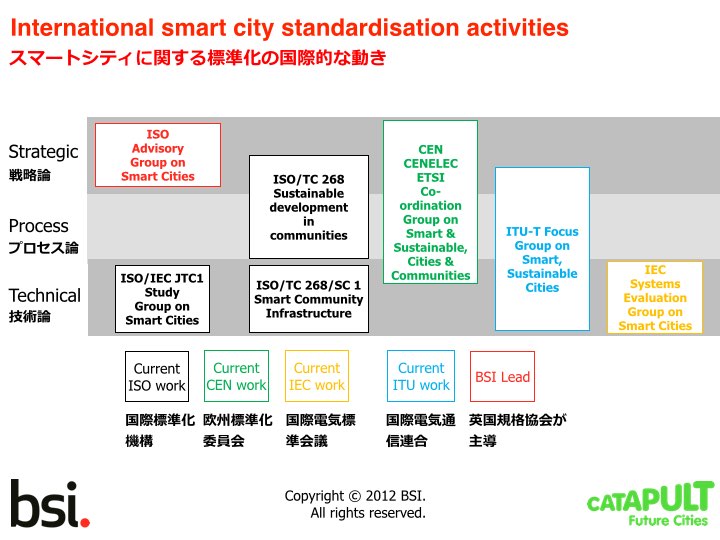
The UK’s work on Smart City standards sits within a rapidly emerging international framework.
So now let me turn to the third and final part of my presentation: London 2012, when I want to describe the evolution of the masterplan for the the Olympic and Paralympic Games, including Space Syntax’s contribution.
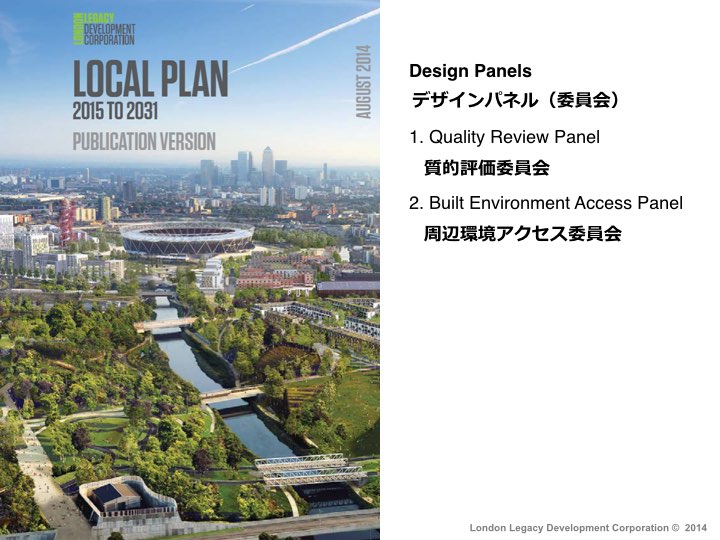
Before I describe the plan itself, it is important to acknowledge the professional process that has created it, especially the efforts that have gone in to ensuring design quality at every stage. From the systematic reviewing of the early masterplan ideas to the continuing scrutiny of the post-Olympic development proposals, many people and organisations have been involved.
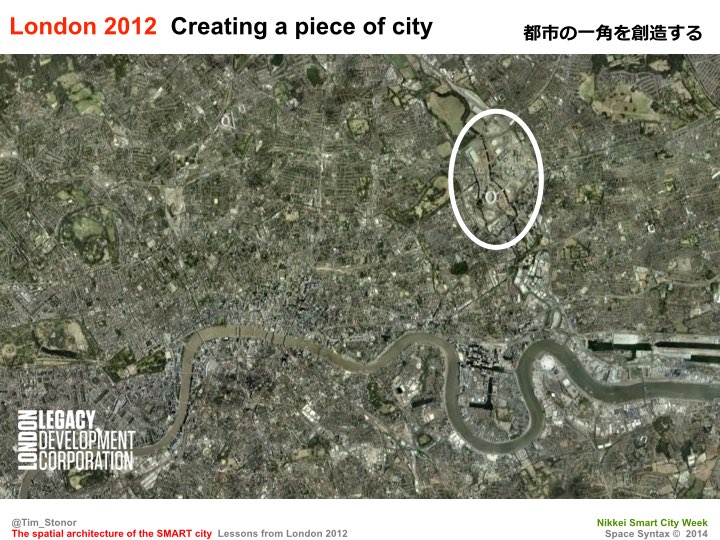
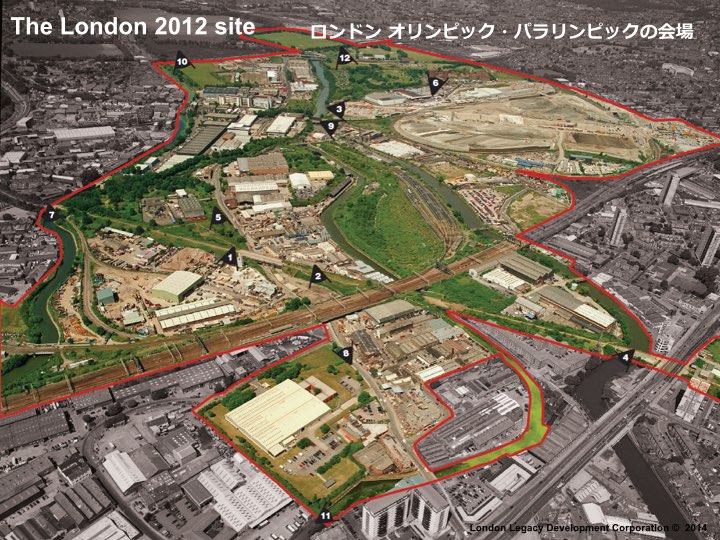
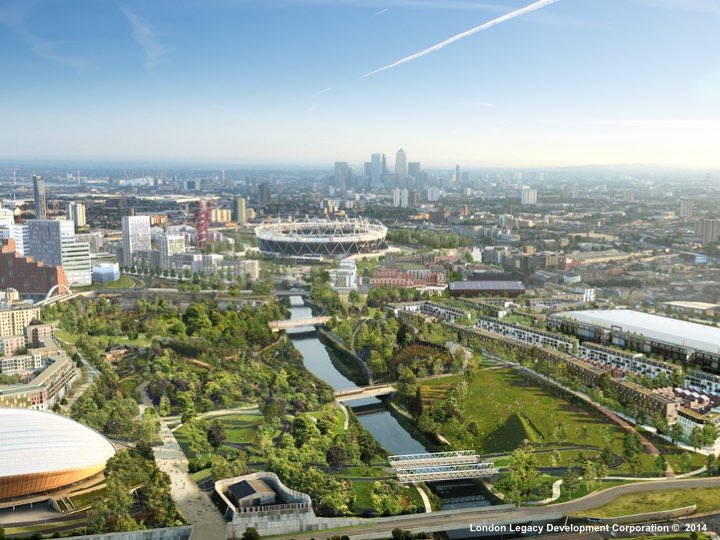
The main Olympic Park is located in the east of London in a part of the city that was previously heavily industrialised.
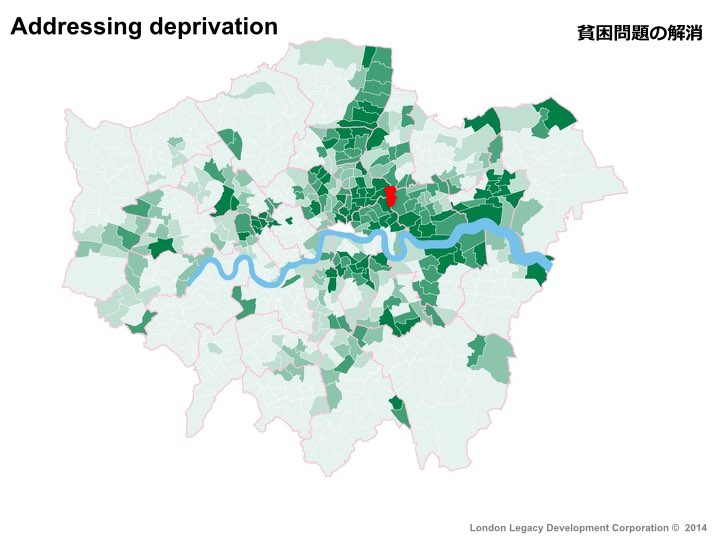
The communities around the Olympic Park account for the greatest cluster of deprivation in England and Wales.
In a class of 30 children, at least 12 are living in poverty.

This economic deprivation has been reinforced by the spatial layout of the area – divided by a tear in the fabric of the street network. This tear was created by the decline of the previous industries – leaving large, empty areas of land, as well as the liner geography of the Lea Valley in which those industries located: a valley that provided water to support industrial production. The Olympic venue was located as part of the regeneration efforts to span this divide.
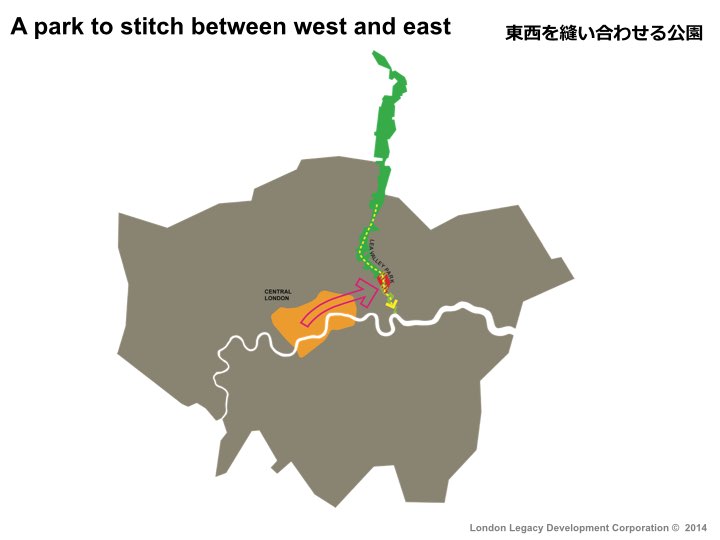
The first move was to see the Olympic Park as one part of a continuous 26-mile long green park that stitches together the two sides of the post-industrial valley.
It was then essential that, in transforming the Olympic site, connections were made into the wider area. The red line that defines the edges of the site could not become a barrier – it needed to be permeable.
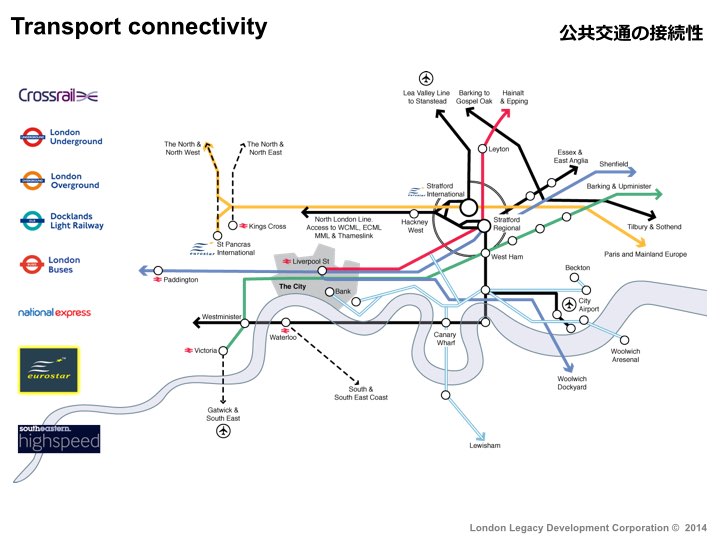
And, as well as local street connections, larger-distance rail connections were also essential. The site is served by 9 tube and National Rail lines, many of which were already there but some which were upgraded as part of the Olympic investment. This is a process that will continue to develop, with further rail connectivity being built after the Olympics, especially the major Crossrail development.
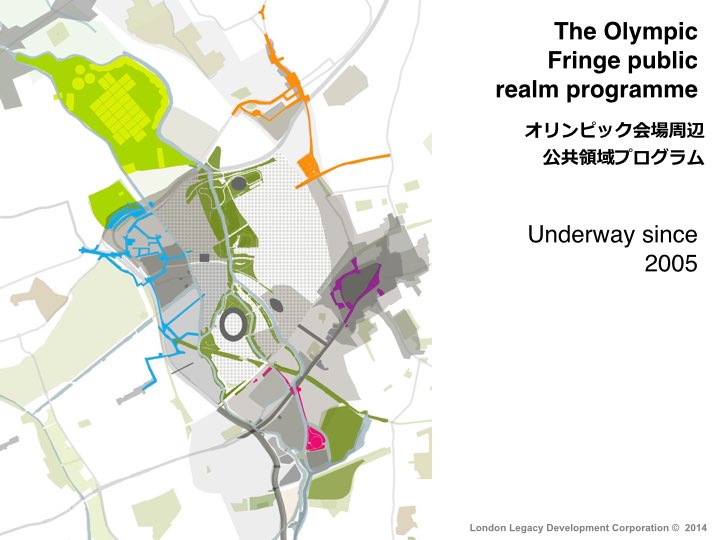
Some of the first steps in developing the Olympic masterplan were not on the site itself but in the areas closest to the park, where local improvements were made to help those areas through the disruption that was expected during the massive construction process.

Space Syntax helped to create a concept for the Olympic Park masterplan – one that made connections between the Olympic Stadium and the Park at the centre and those communities to the west and east.
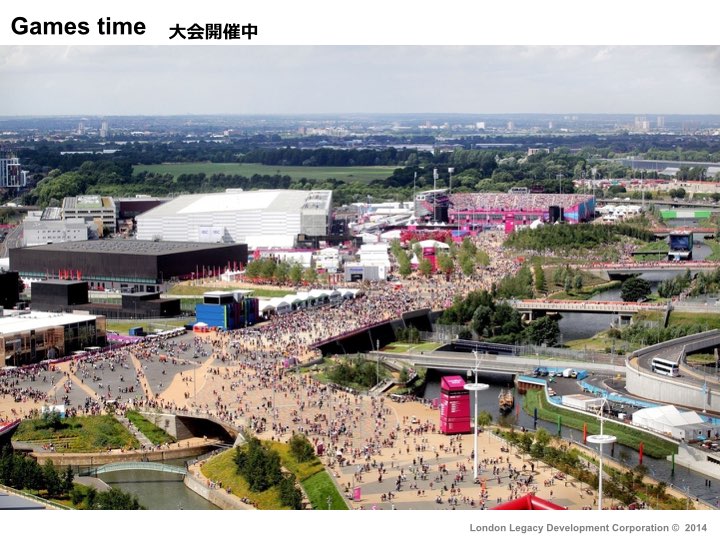
Although those connections were largely closed during the Games themselves – for security and crowd control purposes – the main public concourses used by Games spectators were also planned to be important connections post-Games, thus reinforcing the memory of the Games and ensuring that the expensive infrastructure had a life beyond the Games. This aspect of “legacy” was a defining feature of the 2012 Games: a massive effort went in to make sure that the Olympic Park would be well used for the long term and not just for the few weeks of the Olympic and Paralympic Games.
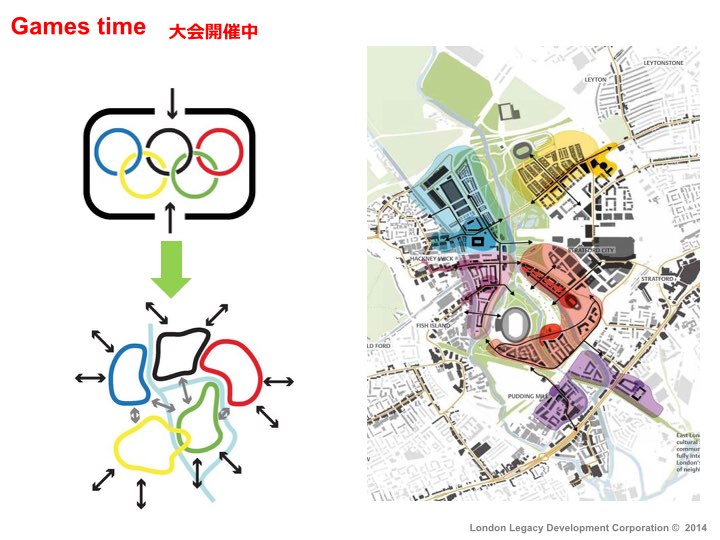
During the Games, the Park was divided into five main zones…
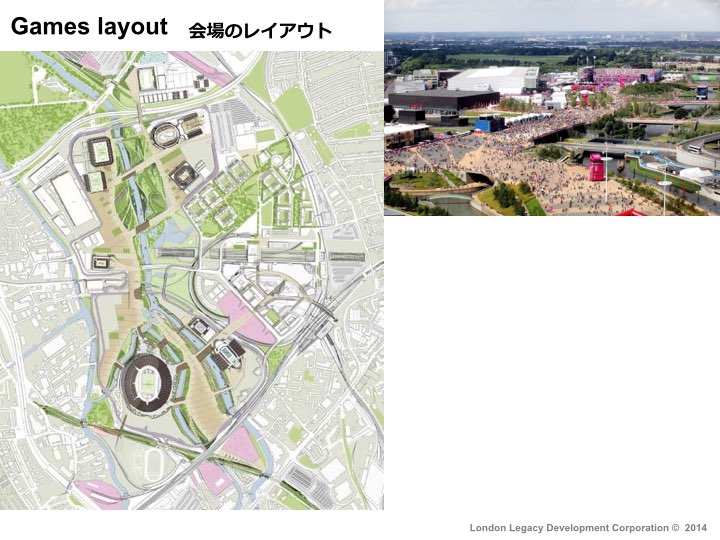
…with the Park at the heart.
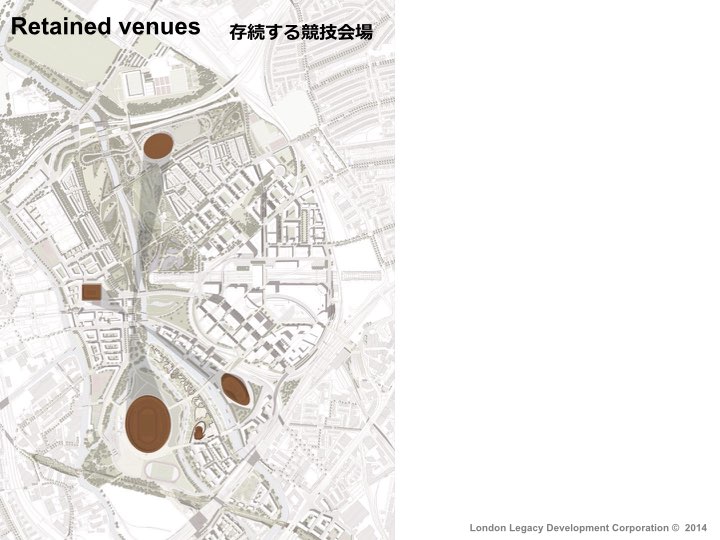
After the Games, key venues – including the Stadium, Velodrome and Aquatics Centre – were retained…
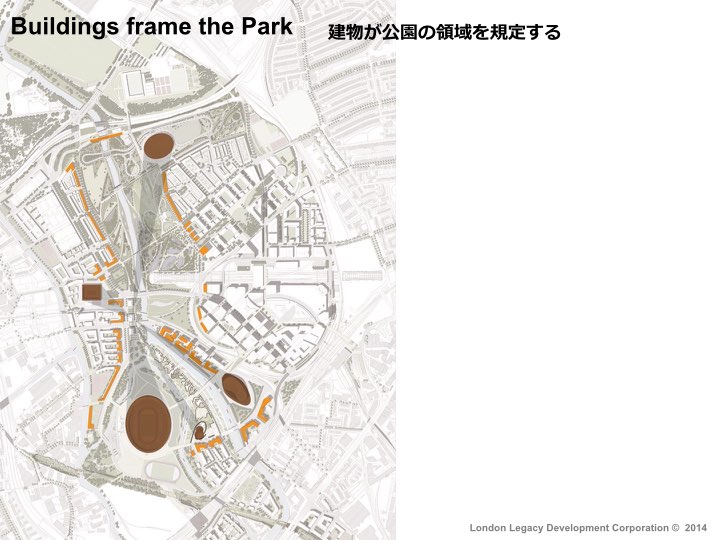
…with buildings constructed to form a frame to the Park – opening onto the Park in the tradition of other major public spaces in London.
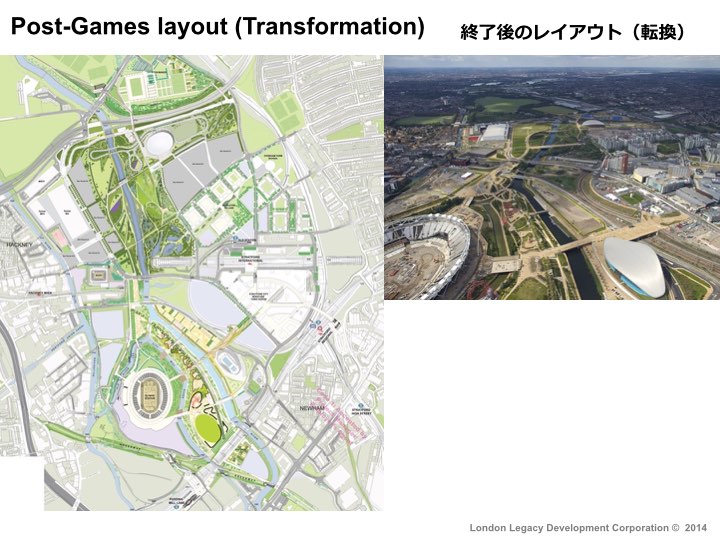
It takes time to fully remove all of the non-permanent structures and to construct the final shape of the Park. This period of Post-Games activity is called the Transformation phase, during which time some of the Park was opened, providing public access.
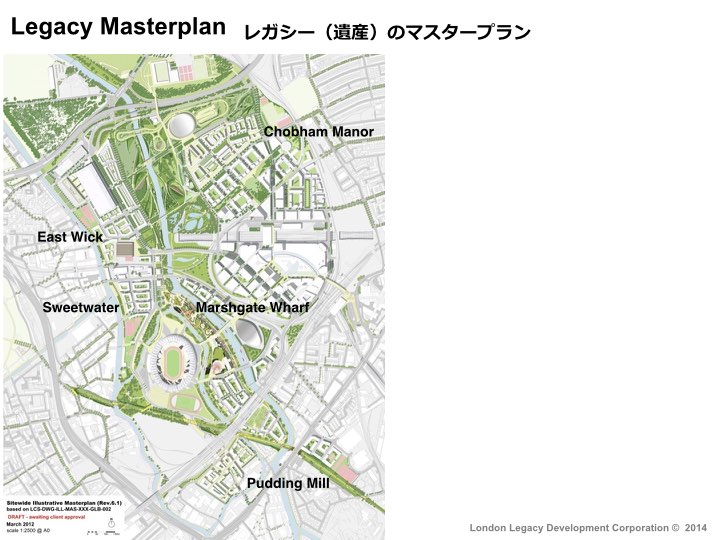
The eventual “Legacy Masterplan” includes outline planning consent for:
5 new neighbourhoods
7,000 new homes
10,000 new jobs
as well as key Social infrastructure:
– 3 schools
– Nurseries
– Community space.
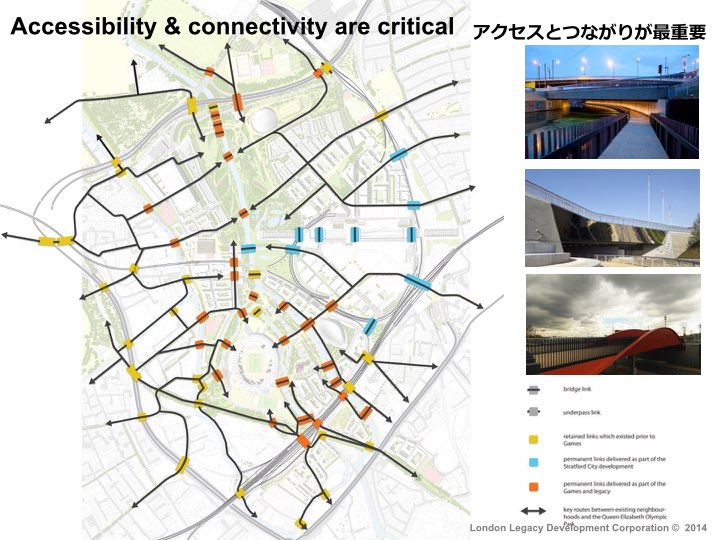
Accessibility and connectivity are critical – linking the site to its surroundings and linking the site within itself. At this point, the organisers again asked for Space Syntax’s advice to identify the hierarchy of these connections: which would be the most important connections, which would need to be wider and designed to allow future commercial activity to take place? Which would be quieter? Were any in the wrong place?

We answered these questions by undertaking a Spatial Layout Analysis – we modelled the proposed Olympic Park and provided detailed advice on the planning of the street network.
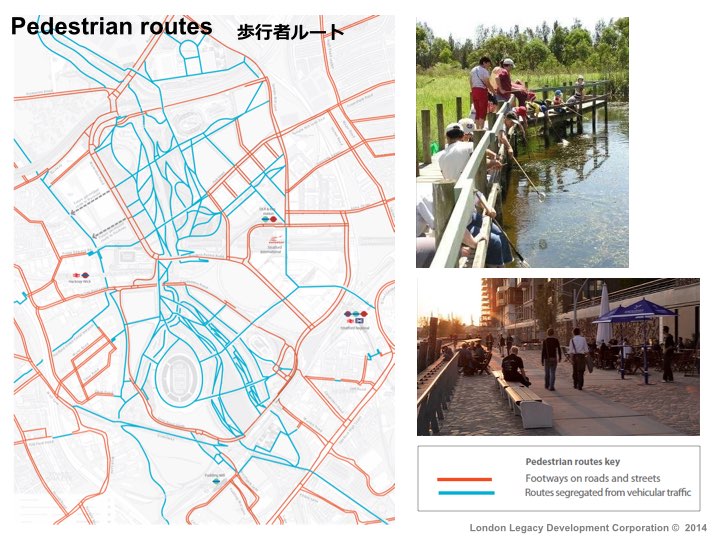
Our advice helped to create the final network of pedestrian routes: the street routes in orange and the park routes in blue…

…as well as the network of cycle routes – of different design characters according to their location and spatial hierarchy.

We modelled the different stages of the project – during the various phases of post-Games transformation. If you look carefully you can see how the route network is progressively opened up in the months and years following the Games.
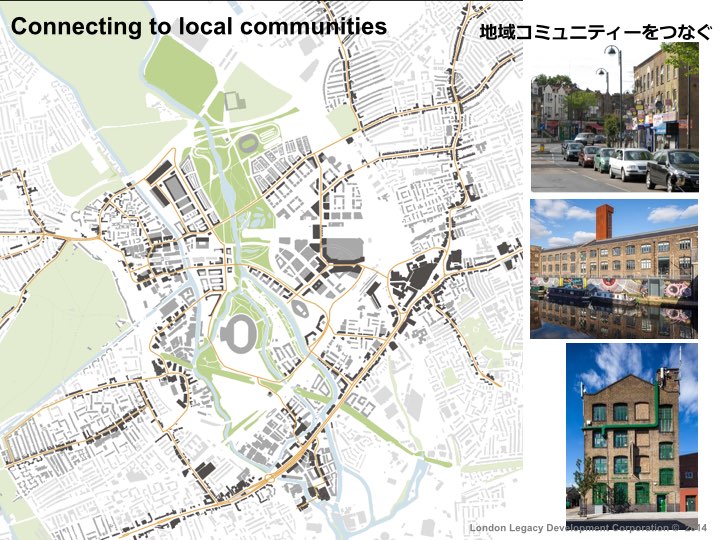
And, in doing so, the new routes connect with the existing local communities to produce a continuous piece of city…
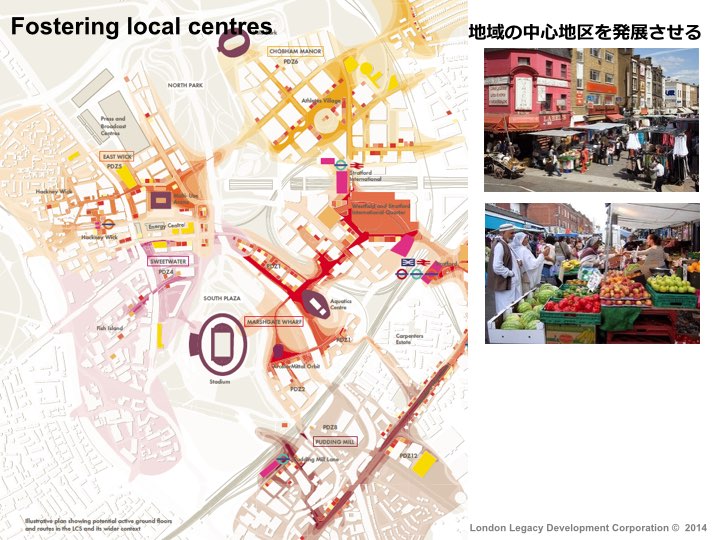
…with local centres that create different focuses with different characters according to the specific mix of activities in each.

The park itself has three key parts: the North Park, Canal Park and South Park…
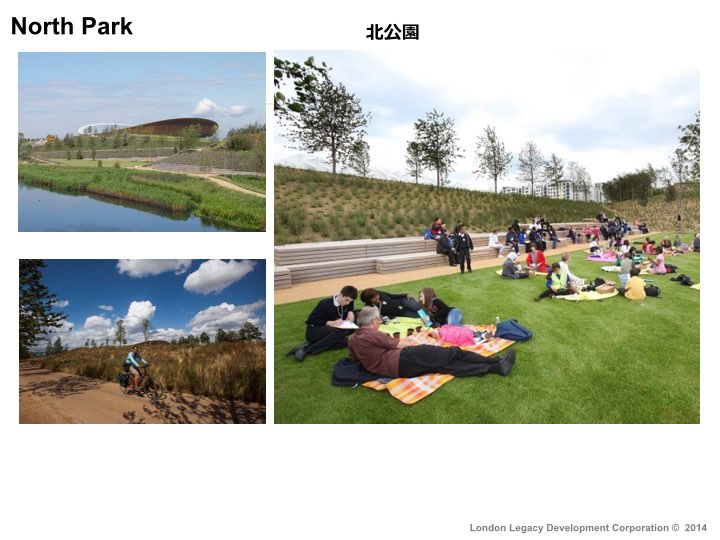
The North Park is designed as a river valley park, combining a wetland habitat with recreation spaces.
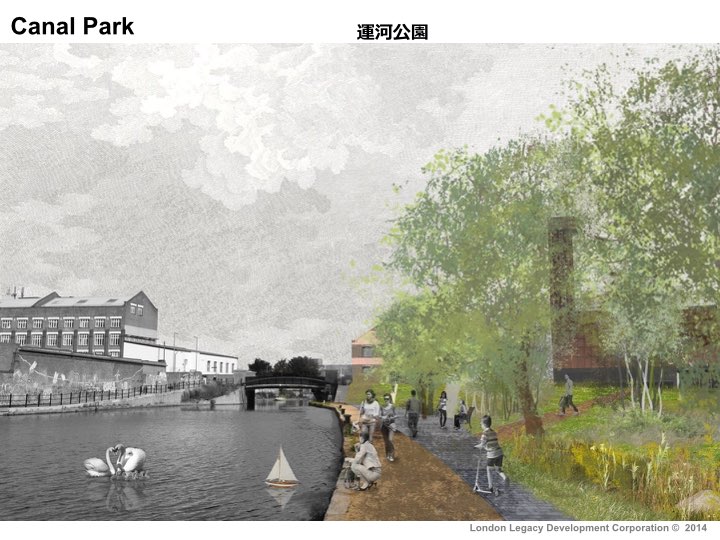
The Canal Park has a more industrial character, running alongside the Lee River and Canal.
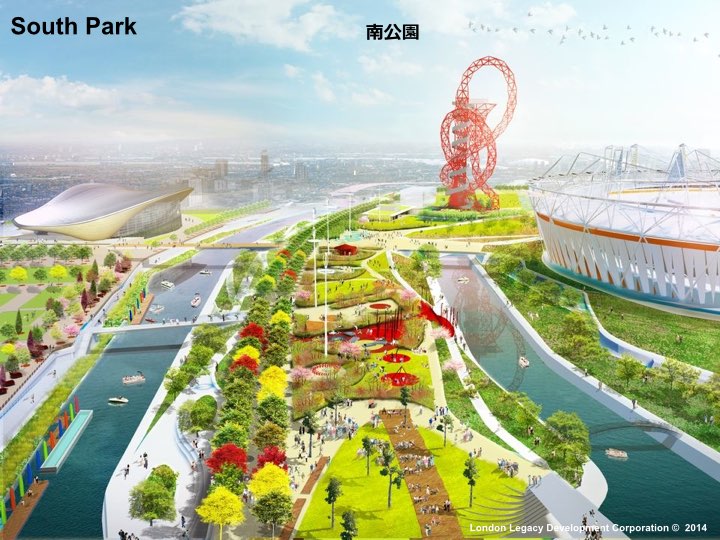
And the South Park is designed to host festivals, big events and civic gatherings.
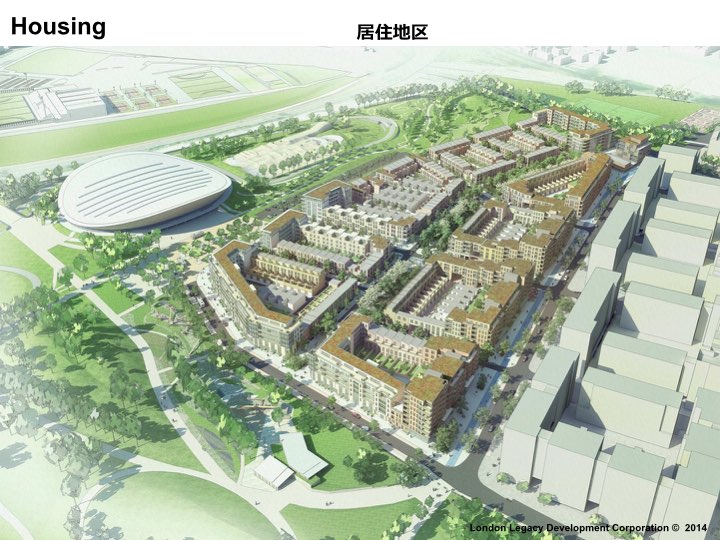
New housing is a key part of the post-Games legacy – both the Olympic Village that was used during the Games as well as new housing to create 850 homes, of which:
– 75% is family housing
28% Affordable housing.
Alongside the housing there will be retail and community space…
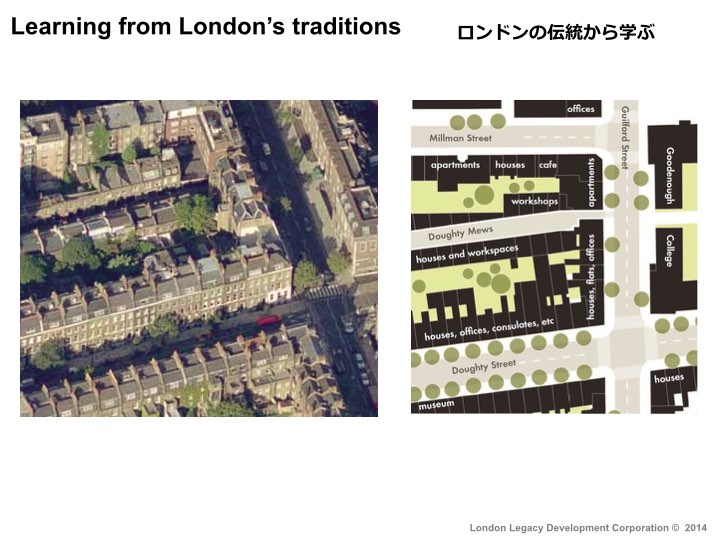
…building on London’s successful tradition of high-density housing.
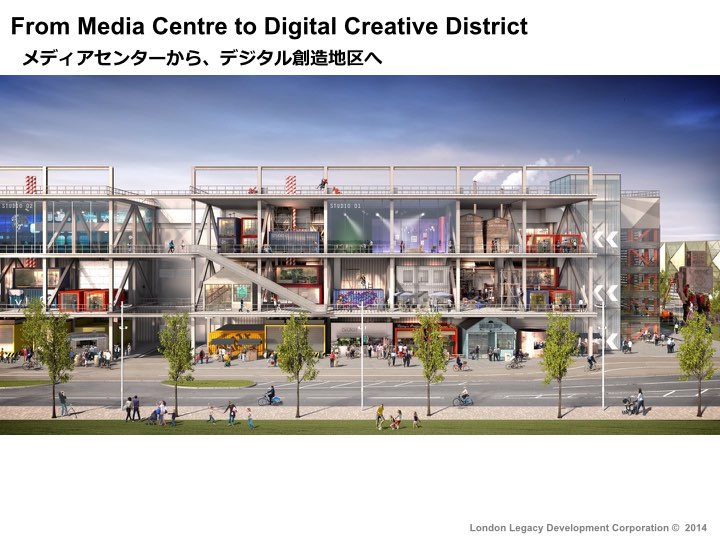
The former Press and Broadcast Centre will be transformed into a digital and creative district, taking advantage of the building’s electronic connectivity.
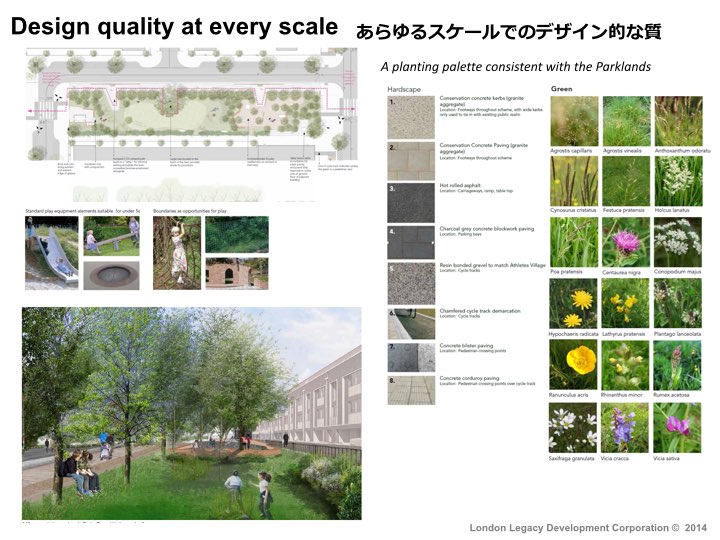
At every scale, design quality comes first, including the detailed choice of planting to create a consistent palette of colours and textures.
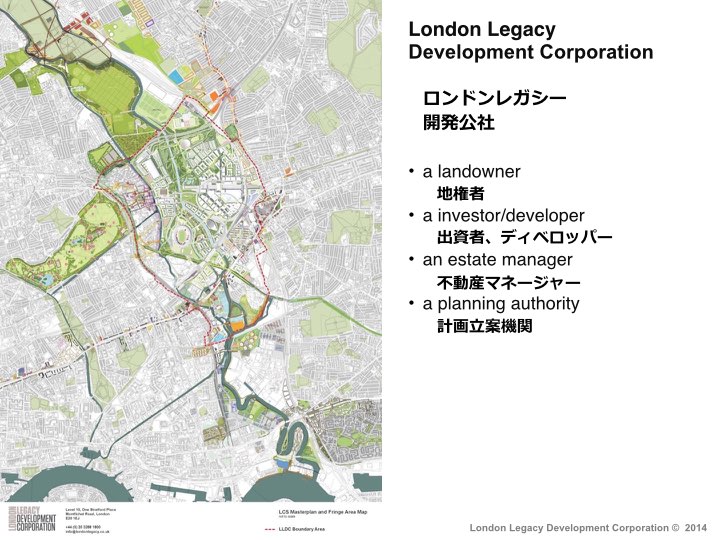
The transformation of the Olympic Park is being overseen by the London Legacy Development Corporation, a body created by the Mayor of London to act as the land owner, developer and manager of the area.
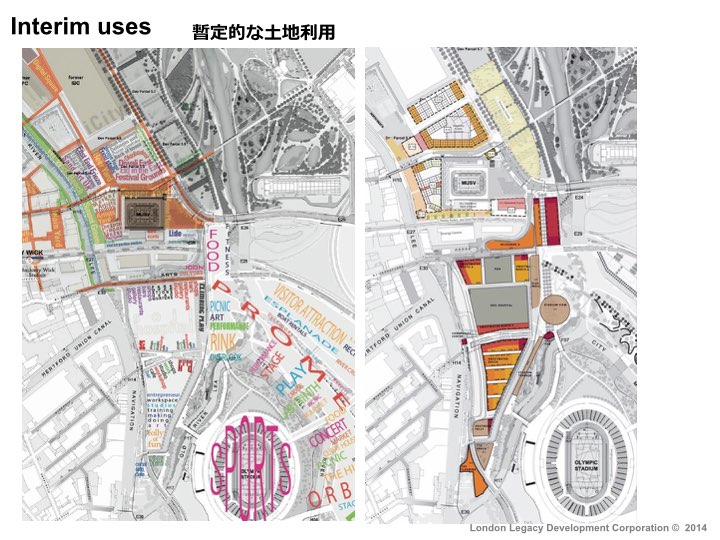
As well as leading the long-term development of the Olympic Park, the London Legacy Development Corporation is also working to encourage interim uses: temporary functions that help to animate the site while new facilities are being constructed.

This approach creates places to try things out, to test, to experiment and to be a little bit free to grow uses that will colonise this new part of London.
This approach is all part of the effort to create a living piece of the city – one that connects the new with the old; a place for people that embraces technology in ways that encourage face-to-face interaction: in other words, a Smart City.
Thank you.

Leave a comment